Showing posts with label DBA Tutorials. Show all posts

Wednesday, January 7, 2009

Free eBook from RedGate : Dissecting SQL Server Execution Plans (Grant Fritchey)

For the last few months I have been working with Understanding SQL Server Execution Plans at a very basic level to provide information on how to get Execution Plans from SQL, how to read them, how to find the information contained in them, and what to look for as flags of potential areas of concern when performance tuning code.  Last night I was having a chat with Jim McLeod, running some thoughts by him when he mentioned this eBook, so I did a quick search and located a free copy from RedGate which I promptly download from:

http://www.red-gate.com/specials/Grant.htm?utm_content=Grant080623

All I can say is WOW.  This has to be the best reference I have ever seen on Execution Plans in SQL Server.  My hats off to Grant Fritchey for first putting this together, but then for making the concepts simple enough that you really don't have to be a Sr DBA to figure out what is happening.  I'd highly recommend this eBook to anyone who writes or reviews TSQL code.

Tuesday, January 6, 2009

Error: 5123, Severity: 16, State: 1 when moving TempDB

This post has been migrated to my new blog on SQLBlog.com. You can find this post at the following address:

http://sqlblog.com/blogs/jonathan_kehayias/archive/2009/01/06/error-5123-severity-16-state-1-when-moving-tempdb.aspx

Wednesday, December 10, 2008

Troubleshooting locking in the database with DMV's

Anyone following my blog knows full well that most of my blog posts come from the MSDN Forums. So it should be no surprise to you if you follow my blog, that this one is yet again another question from the forums.

This one deals with locking in the database engine and how to identify what the index and object names are for locks that are taken and reported in sys.dm_tran_locks.  The resource_type column in this DMV provides information about what lock is taken, and for PAGE and RID types the resource_description column will have a page identifier like 1:2453977.  However for KEY types, the resource_description is a somewhat "cryptic" value like (52004e8d59a4). 

The question posed was how to get the index/objectid from this value.  The answer is simply, you don't/can't.  The assumption that the resource_description column is the key to the object is wrong.  The actual key to the object is the resource_associated_entity_id which is the sys.partitions DMV's hobt_id.  By joining these two views together, it is very easy to get back to the index and object since the sys.partitions DMV carries the object_id and index_id for the allocation unit being locked.  The following query demonstrates how to get the information details for a lock out of the storage engine:

SELECT dm_tran_locks.request_session_id,
      
dm_tran_locks.resource_database_id,
      
DB_NAME(dm_tran_locks.resource_database_id) AS dbname,
      
CASE
          
WHEN resource_type = 'object'
              
THEN OBJECT_NAME(dm_tran_locks.resource_associated_entity_id)
          
ELSE OBJECT_NAME(partitions.OBJECT_ID)
      
END AS ObjectName,
      
partitions.index_id,
      
indexes.name AS index_name,
      
dm_tran_locks.resource_type,
      
dm_tran_locks.resource_description,
      
dm_tran_locks.resource_associated_entity_id,
      
dm_tran_locks.request_mode,
      
dm_tran_locks.request_status
FROM sys.dm_tran_locks
LEFT JOIN sys.partitions ON partitions.hobt_id = dm_tran_locks.resource_associated_entity_id
JOIN sys.indexes ON indexes.OBJECT_ID = partitions.OBJECT_ID AND indexes.index_id = partitions.index_id
WHERE resource_associated_entity_id > 0
 
AND resource_database_id = DB_ID()
ORDER BY request_session_id, resource_associated_entity_id

In researching this question, I actually learned a good bit more about object identification in SQL Server 2005 and 2008.  The sys.partitions table is actually a key table in deadlock analysis as well, which I will blog about in another entry, since deadlocks are one of my favorite subjects to

Tuesday, December 9, 2008

SQL Server 2008 Extended Events - Reference List

One of the best kept secrets of SQL Server 2008 has to be the new Extended Events architecture that was added to the troubleshooting toolset. The Extended Events Engine is the foundation on which Extended Events provide detailed information from inside the database engine. I wrote good coverage of Jerome Halmans session at PASS on them for Universal Thread at:

http://www.utcoverage.com/PASS/2008/

However, that only slightly begins to cover the subject. I spent over a month figuring out Extended Events while working on the Extended Events Manager application that won the SQL Heroes contest. Back then the information on Extended Events was very limited. There were numerous errors in the Books Online, and only Bob Beauchemin had blogged about it. (BTW, I owe a great debt of gratitude to Bob for his willingness to test my app, and provide feedback early on. He also provided me some excellent recommendations along the way.)

However as time goes on, things change, and good information is fairly readily available on the subject today. First Paul Randal, recently published an article in Technet Magazine that you can find through his blog post. Then coming in the February/March 2009, the topic will be covered in the Microsoft® SQL Server® 2008 Internals (Pro - Developer) which is available for pre-order now. (Watch for a quick review from me when it actually ships. I plan to dedicate my time to reading this.)

Some web references on XEvents (Extended Events) are:

http://blogs.msdn.com/sqlqueryprocessing/archive/2006/11/12/using-etw-for-sql-server-2005.aspx
Introducing SQL Server Extended Events
MSDN Webcast: SQL Server 2008 Advanced Troubleshooting with Extended Events (Level 200)
Debugging slow response times in SQL Server 2008

Thursday, December 4, 2008

SQL Server Backup Fundamentals - Mirrored Backup vs Striped Backup

SQL Server Backup isn't necessarily the easiest thing in the world to do.  I've seen a few posts recently where the poster is performing a restore operation and encounters the following error message:

TITLE: Microsoft SQL Server Management Studio
------------------------------

Restore failed for Server 'ServerName'.  (Microsoft.SqlServer.Smo)

For help, click: http://go.microsoft.com/fwlink?ProdName=Microsoft+SQL+Server&ProdVer=9.00.1399.00&EvtSrc=Microsoft.SqlServer.Management.Smo.ExceptionTemplates.FailedOperationExceptionText&EvtID=Restore+Server&LinkId=20476

------------------------------
ADDITIONAL INFORMATION:

System.Data.SqlClient.SqlError: The media set has 2 media families but only 1 are provided. All members must be provided. (Microsoft.SqlServer.Smo)

For help, click: http://go.microsoft.com/fwlink?ProdName=Microsoft+SQL+Server&ProdVer=9.00.1399.00&LinkId=20476

------------------------------
BUTTONS:

OK
------------------------------

What is really sad is that the person encountering this error is often in the midst of a disaster recovery, and unfortunately, they are learning the hard way why testing your backups early, and testing your backups often is a recommended best practice for a reason.  Unfortunately, if you find yourself with this error and this is the only backup of the database you need to restore, you are in serious trouble, because just like a RAID 0 disk, there is no way to rebuild your database without all the backup files in the media set present.  At this point, you might not believe me, and you certainly have that right, but I am presenting the cold hard truth and you can validate this by doing a Google Search or a Windows Live Search. 

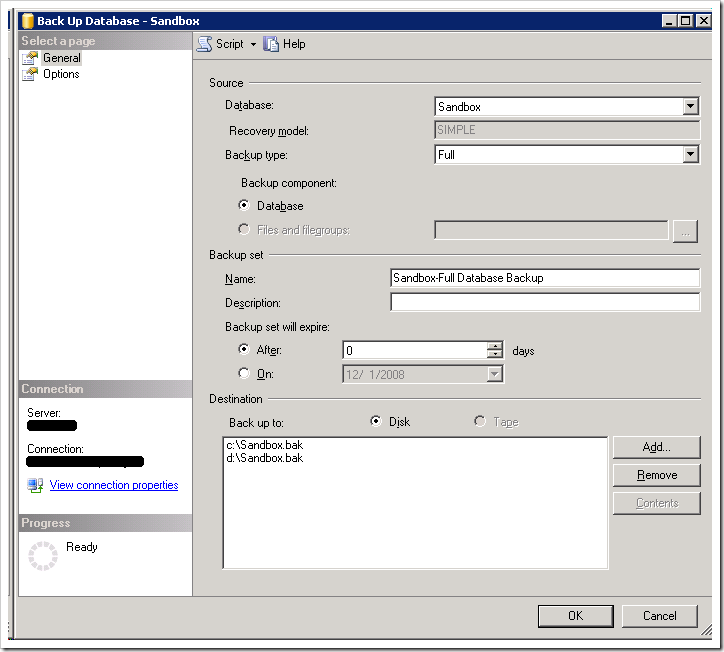
So how exactly does this particular error come about?  For more than a few people it has been caused by SQL Server Management Studio, and confusion about the UI for backing up a database.

image

To someone new to SQL Server, this looks like it might be performing a backup to c:\Sandbox.bak and making a duplicate or mirrored copy to d:\Sandbox.bak.  In reality, this is not the case.  Instead this is performing a striped backup similar to a RAID 0 disk which will write the data round robin to all of the files listed.  Striping backups can be used to improve performance of the backup operation, especially for VLDB's using multiple drives with dedicated I/O channels to each of the drives.  The backup TSQL command from the above scripted out would be:

BACKUP DATABASE [Sandbox] 
TO DISK = N'c:\Sandbox.bak',
DISK = N'd:\Sandbox.bak'
WITH FORMAT,
NAME = N'Sandbox-Full Database Backup',
SKIP, NOREWIND, NOUNLOAD, STATS = 10
GO


To create a mirrored backup, you can't use the UI in SQL Server Management Studio, you actually have to use TSQL Scripts following the Book Online entry for BACKUP DATABASE.  The MIRROR TO option is used to create the mirrored backup as follows:


BACKUP DATABASE [Sandbox] 
TO DISK = N'c:\Sandbox.bak'
MIRROR TO DISK = N'd:\Sandbox.bak'
WITH FORMAT,
NAME = N'Sandbox-Full Database Backup',
SKIP, NOREWIND, NOUNLOAD, STATS = 10
GO


The bad thing as I stated previously in this post is that someone doesn't realize the mistake until it is to late.  When was the last time that you tested your backups?  Testing would have caught this problem well ahead of it actually being a problem. 

Wednesday, December 3, 2008

Estimating the Size of your Database Backups

I think I have answered a dozen or so questions regarding how to estimate the size of database backups without running the backup in the last few months on the Forums.  It is really quite simple to estimate how large a backup will be for a database.  The sp_spaceused system stored procedure will show how much reserved space there is in the database.  This is roughly equivalent to the size that the backup will be when it completes.

USE SQLCLR_Examples
GO
EXEC sp_spaceused @updateusage = 'true'
           

database_name                         database_size      unallocated space

------------------------------------- ------------------ ------------------

SQLCLR_Examples                       6031.50 MB         4326.55 MB

reserved           data               index_size         unused

------------------ ------------------ ------------------ ------------------

988624 KB          944216 KB          43200 KB           1208 KB

I create a backup with the following command:

BACKUP DATABASE [SQLCLR_Examples]
TO DISK = N'D:\SQLCLR_Examples.bak'
WITH NOFORMAT, NOINIT,
NAME = N'SQLCLR_Examples-Full Database Backup',
SKIP, NOREWIND, NOUNLOAD, STATS = 10

Then look at its size with the following command:

SELECT CONVERT(VARCHAR, CONVERT(DECIMAL(18,1), backup_size/1024))+ ' KB' [Backup Size]
FROM msdb.dbo.backupset
WHERE database_name = 'SQLCLR_Examples'
 
AND backup_finish_date > DATEADD(hh, -1, GETDATE())

Backup Size

---------------------------------

993573.5 KB

So you can see from this demonstration that the size of the backup is roughly equal to the reserved space in the database from sp_spaceused.  The updateusage parameter is sometimes needed to account for changes that have occured but are not yet reflected in the usage stats for the database.

Tuesday, December 2, 2008

Find databases missing a backup

If you manage multiple servers, and you don't have complete control over your database backups, then you need to be checking regularly that all of your databases are indeed being backed up. With SQL Server 2008, Policy Based Management makes this very easy to do. There is a Microsoft Books Online entry for this:

Monitoring and Enforcing Best Practices by Using Policy-Based Management

You don't have to be on a SQL Server 2008 server to use PBM. You can actually use it manually from SQL Server Management Studio by downloading the Express Edition of 2008 with Tools. However, if you are not taking the leap to SQL Server 2008 anytime soon, you still need to know how to monitor this. You can do so with a simple TSQL Query using a few system tables:


SELECT database_name, last_backup
    
FROM
    
(  
    
SELECT database_name, MAX(backup_finish_date) [last_backup]
        
FROM msdb.dbo.backupset
                
JOIN MASTER..sysdatabases d ON database_name = d.name
        
WHERE TYPE = 'd'
        
GROUP BY database_name
        
UNION ALL
    
SELECT d.name, NULL
        
FROM MASTER..sysdatabases d
        
WHERE NOT EXISTS (
        
SELECT 1
            
FROM msdb..backupset
            
WHERE d.name = database_name)
    )
AS tab
    
WHERE tab.last_backup < GETDATE()-14
        
OR tab.last_backup IS NULL

I intentionally use the legacy table sysdatabases table so that this script works across all platforms exactly the same way. If you were to download the Express Edition of SQL Server 2008 Management Studio, you could hit all of your SQL Servers regardless of edition, (2000, 2005 and 2008) with this on a multi-server query. Want to know how to do that, see my article on this
Multiple Server Queries with SSMS 2008 - SQL Server Central

I know that is kind of a shameless plug, but it is what it is.

Monday, December 1, 2008

Automating Common DBA Tasks Complete Series

I have blogged about this briefly in the past, but I am going to post a full link set to all of the code that I use to automate monitoring of my production database servers. All of the code is available on the MSDN Forums SQL Examples Wiki site, and I might back post the series in my blog at a later date but I may not.  The entire series is sub categorized under the main article Automating Common DBA Tasks.

Inside this the code is sub-categorized into TSQL monitoring through SQL Agent:

Configuring SQL Server 2000 Notification with CDOSys
Configuring SQL Server 2005/2008 Database Mail
Log file growth in SQL Server
Monitor free space in the database files
Monitor free space on the server hard disks
Monitor the SQL Server Error Log
Monitor long running SQL Agent Jobs
Monitor failed SQL Agent Jobs

and VBScript/WMI monitoring through Windows Task Scheduler:

Monitor Service Status
Monitor System Event Logs
Monitor Running Process Information

Please feel free to contact me and let me know if you have any issues with using this code.  It is not exactly identical to the code in my production servers since there is some proprietary information in my own production code, but the changes are only slightly minor, and I have done my best to test and validate the code I published, and it all should work as intended.

Wednesday, November 26, 2008

The Database Transaction Log - Part 2: How the Transaction Log Works

The transaction log files are different from the database data files in the way that they are used, as well as how the space is allocated inside of them.  The Log files, unlike standard data files are written to sequentially.  For this reason, it is often best for the logs to be on dedicated disks for log use only.  Since the IO is all sequential, random I/O from the data files could impact performance of logging.  The log files are subdivided internally into Virtual Log Files as shown in the below picture from the Books Online:

VLF Division

The number of VLF's in the transaction log can be found using DBCC LOGINFO.  This is an undocumented command, but it provides some very useful information regarding the transaction log for a specific database.  The following image shows the output of DBCC LOGINFO for AdventureWorks on my laptop:

image_thumb[2]

As can be seen in the image, there are 4 VLF's in the transaction log.  The FSeqNo provides the logical order of the VLF's inside of the physical log files.  The Status column provides information as to whether a specific VLF is currently being used (2) or if it is available for use (0).  FileSize and offset provide information about the actual location of the VLF inside the physical file structure, and how large the VLF actually is. The actual sizing of the VLF is important to pay attention to.  If your VLF's are to small, then you will have excessive numbers of VLF's in your log files.  If they are to large, then they won't truncate free space effectively or efficiently. 

As mentioned previously, the transaction log is a sequentially written file that is used in a round robin fashion.  The start of the log file may not be the current start of the logical log.  The following image from the Books Online shows how a single log file with four virtual log files is used by the database server.

LogUsageSingleFile

The start of the logical log in this case is at the beginning of the third VLF.  Since the log is written sequentially, the log moves from the start of the third VLF through the fourth VLF and when it reaches the end of the file, starts back over at the beginning of the log file if there is free space.  So long as the end of the logical log never gets back to the start of the logical log, the transaction log will stay the same size.

In a two file system, the files are used sequentially, and unlike the database data files which are striped.  With two transaction log files, the first file is used, and then the second file is written to following the below picture:

TransactionLogMultiFileUsage

As long as the log space is truncated, the logs can continue to be used in a round robin fashion that prevents growth from being required.  The mechanism for truncation differs depending on the recovery model selected for the database in question.  If the database is in FULL recovery,  then the log is truncated when it is backed up using the BACKUP LOG command.  In SIMPLE recovery, the log truncation occurs on checkpoint for all complete transactions.  The active portion of the transaction log should remain fairly small for SIMPLE Recovery.  Exceptions to this would be large long running transactions as covered in my previous posting.

Thursday, November 13, 2008

The Database Transaction Log - Part 1: Managing Size

This post will be the start of a series on the Database Transaction Log.  This started out as a single posting, but the topic is vast that there is no way to properly cover it in a single post.  I could probably write a mini pamphlet on the transaction log in SQL Server the topic is just that big.  I plan to focus on common problems that I consistently see on the MSDN Forums regarding the transaction log, as well as how to prevent/correct them.

The transaction log in SQL Server is one of the most important parts of a SQL Server database, as well as one of the most common generators of problems I see online.  If you don't believe me, do a Google, MSN, or Yahoo search for 'transaction log full', and you will find article after article and question after question dealing with the subject.  Worst yet are the stories of a deleted transaction log:

http://www.sqlservercentral.com/articles/Disaster+Recovery/63311/
https://forums.microsoft.com/MSDN/ShowPost.aspx?PostID=2727860&SiteID=1
http://bytes.com/forum/thread543465.html

To start with let me first say that you should never, ever, never, under any circumstances delete your database log file.  This is, as Jens Suessmeyer put it, "the transactional heart of the database." 

In a managed database server the database data/log files should only grow when specified by a Database Administrator.  This is not to say that you should turn AutoGrowth OFF on the databases in your environment.  I prefer that this option is left ON as a sort of insurance policy for your database in the event that the space available drops fast enough that you can't react in time to prevent a problem.  It should however, be configured to grow by a fixed size rather than a percentage.  The reason for this is that a fixed size has a predictable cost should the database have to grow automatically whereas a percentage size will be more and more expensive the larger the database grows to. 

I previously blogged about the How to Automate Common DBA Tasks series that I posted on the MSDN Forums Example Site.  One of the articles included in that series is a Data File Free Space monitoring script.  This can be used to monitor the available free space in the log files, and provide early notification to an administrator that they need to grow the file.  By manually managing the size of the log file, an administrator will know if there is a problem almost immediately.  The transaction log on an established database should very rarely have to be grown once properly sized.

So what exactly will cause the log file to fill up and need to be grown?  There are a number of things that can cause this:

  1. Full Recovery Model without Log Backups
  2. Long running transaction
  3. Uncommitted transaction
  4. Rebuilding Indexes
  5. Loading Bulk Data without minimizing logging.

The first item listed is the primary reason that log files get to be oversized, and eventually consume all of the available disk space on the server.  I have yet to figure out why or how, but almost every time that someone posts a problem with an oversized transaction log, the database is in FULL Recovery, and the only backups being performed are nightly full backups.  If you are not backing up the transaction log between full backups, then the database should be in SIMPLE recovery.  The reason for this is that the transaction log is not truncated in FULL recovery except by log backups using the BACKUP LOG command, and specifying WITH TRUNCATE_ONLY doesn't make sense.  If you aren't going to backup the logged data for point in time recovery purposes, then there is no reason to not have it auto truncate on checkpoint.

Long running transactions most often associated with a growing or oversized transaction log are generally data purging processes that are running as a single transaction like the following:

DELETE 
FROM MYTABLE
WHERE MYCOL
< @Criteria

Purging data like this will be heavily logged, even on databases in SIMPLE recovery.  The reason being that there is no commit between the start and commit, so if one million rows are being deleted, then the log has to hold all one million deletes to be able to perform a rollback of the operation.  The appropriate way to purge data like this was provided by fellow forum member Adam Haines in response to numerous forums postings:


DECLARE @BatchSize INT,
@Criteria DATETIME
SET
@BatchSize = 1000
SET @Criteria = '1/1/2005'

WHILE EXISTS(SELECT 1 FROM MYTABLE WHERE MYCOL < @Criteria)
BEGIN
DELETE TOP
(@BatchSize)
FROM MYTABLE
WHERE MYCOL < @Criteria
END

Another solution to this problem was provided by Denis the SQL Menace is:


DECLARE @BatchSize INT,
@Criteria
DATETIME,
@RowCount
INT
SET @BatchSize
= 1000
SET @Criteria = '20050101'
SET @RowCount = 1000

SET ROWCOUNT @BatchSize

WHILE @RowCount
> 0
BEGIN
DELETE
FROM MYTABLE
WHERE MYCOL
< @Criteria

SELECT @RowCount = @@rowcount
END

SET ROWCOUNT 0

Both of these solve the problem by working in smaller implicit transactions which will perform much better, as well as control the size of the transaction log. 


Uncommitted/Open transactions are problematic beyond just causing transaction log growth.  An open transaction will also cause excessive blocking in the database which will also impact the application users.  To find open transactions in a database, you can use DBCC OPENTRAN, which will return the active transactions in the current database.  To demonstrate this, run the following statement in one window:


use tempdb
go
create table mytable
(rowid int identity primary key)

begin transaction
insert into mytable default values

Then open a new window and run:


dbcc opentran

The output from DBCC OPENTRAN will show the open transaction and offending SPID in the database as follows:


Transaction information for database 'tempdb'.

Oldest active transaction:
    SPID (server process ID): 55
    UID (user ID) : -1
    Name          : user_transaction
    LSN           : (20:44:214)
    Start time    : Nov 13 2008 10:35:09:780PM
    SID           : 0x01050000000000051500000064116832e36ccd723422e75bba640000
DBCC execution completed. If DBCC printed error messages, contact your system administrator.


To investigate this further, you can use DBCC INPUTBUFFER(spid#) to get the last command run on the offending SPID.  From there, you can determine what action you want to take, whether to kill the offending SPID and cause it to rollback, or maybe troubleshoot further to identify what caused the transaction to be left open.


Rebuilding Indexes and bulk loading data should both be done in SIMPLE or BULK_LOGGED recovery.  The reason for this is to minimize the logging that is done, but you can't eliminate it completely.  In my experience, rebuilding indexes can require a transaction log to be larger than the size of your largest index.  This is where sizing your log file is important as a part of future capacity planning, and should be done considering how large the database might be in the future.


If you are reading this because you are already in trouble, there are a number of ways to deal with a oversized transaction log, and none of them necessitates deleting the file from the file system.  If you get yourself to the point that your server is completely out of disk space, there is no network path where you can backup your log to, and the log is in the hundreds of GB in size, then the best recommendation is to put the database into Simple recovery, which will truncate the active portion of the log and allow it to be shrunk.  I would highly caution and recommend that a new Full backup of your database be taken immediately after performing such an operation.


Look for further postings on the Transaction Log to come.


References:
http://support.microsoft.com/kb/873235
http://support.microsoft.com/kb/317375/

Friday, November 7, 2008

Are you safe without your Keys?

I am not talking about your house keys, or your car keys, I am talking about your SQL Server Keys.  SQL Server 2005 allows you to use keys for protecting objects and data in the server and databases.  It is very likely that if you are doing encryption in SQL Server that you already know that you have keys in SQL, but if you have never touched encryption, you might now know that, you too, have at least one key in SQL, the Service Master Key.  For those not familiar with this, the Service Master Key is the root of encryption key hierarchy in SQL Server 2005, it is by default used to encrypt Database Master Keys, linked server security information, and any credentials created using CREATE CREDENTIAL.  If you don't use any of the above, then read no further, you are probably fine.

Personally, I learned about keys, certificates, and encryption while studying for my MCITP Database Administrator exams at the beginning of this year, and that was enough to add a backup of the SMK into a password protected file to my installation procedures for each SQL Server Instance I have.  I personally have never needed to use the backup to date.  So what sparked this blog posting?  As usual, a post on the MSDN Forums, where a backup of a database using encryption was restored to a different server, and the poster didn't know the password to the database master key.  After goofing the initial answer on it, I had to do some investigating into what could be done in the case that the password to encrypt a DbMK is lost, and the answer isn't all that complex, and it is included in the post referenced above. 

However, it is much easier to just avoid the situation completely and have available backups of the SMK, as well as all the other keys in use in your database server. These can easily be done with DDL commands:

BACKUP SERVICE MASTER KEY (Transact-SQL)
RESTORE SERVICE MASTER KEY (Transact-SQL)

BACKUP MASTER KEY (Transact-SQL)
RESTORE MASTER KEY (Transact-SQL)

BACKUP CERTIFICATE (Transact-SQL)
CREATE CERTIFICATE (Transact-SQL)

One of the best references online is Laurentiu Cristophors blog on MSDN for security and cryptography in SQL Server.  Laurentiu is a frequent answerer in the SQL Security forum on MSDN, and has wealth of information available about this subject.  His blog is definitely a recommended read and is on my personal blog roll.

Since this is such a vast subject, I plan on putting some time into it in the near future, and writing some additional information on the subject.  However, in the mean time, backup those keys and certificates.

EDIT:  One thing I realized while thinking about his blog is I do have two different Certificates implemented in my servers, one for mirroring between two servers not on a domain, and one for a certificate user to provide permissions for a dynamic SQL search procedure that uses parameterized dynamic SQL to perform optimized searching in one of our databases, since application users are required to use stored procedures and have no table level access.  The certificate user has no associated login and is used WITH EXECUTE AS to provide the needed table level SELECT rights to run dynamic SQL code in the stored procedure.  The calling user only has execute rights on the stored procedure but can still make use of its dynamic code due to this type of impersonation.  I do have backups of both of these certificates, as created when they were created.

If you want more information about using Certificates to grant elevated rights with a Certificate User look at Erland Sommarskogs article Giving Permissions through Stored Procedures.

Thursday, November 6, 2008

Are your Disks Aligned Properly?

I am always on the lookout for new blogs to watch and learn from.  Not long ago, Kevin Kline wrote a very intriguing blog post:

How to Improve Application and Database Performance up to 40% in One Easy Step

I read it, but I didn't get a lot of time to dig into it until recently.  I finally got around to digging into the topic more, and I also spoke to one of our server admin's about it.  Doing some research we found that our entire environment is running on misaligned partitions.  I found an additional resource blog post that has an excellent slide deck on the MSDN blogs by a guy name Jimmy May:

Disk Partition Alignment (Sector Alignment) for SQL Server: Part 1: Slide Deck

I am working on doing some testing of this by rebuilding a disk completely to see how it affects SQLIO benchmarks before and after.  I'll post results later on, but this topic is definitely an interesting subject.

More to come........

Tuesday, November 4, 2008

Automating Common DBA Tasks

A few weeks ago I did a live meeting presentation for the PASS Database Administrators Special Interests Group (DBA SIG) on Automating Common DBA Tasks.  I spent the last few weeks trying to figure out how to put the source code from my own processes online for others to view/use.  One problem I encountered is that I never designed this to be used by anyone other than myself, so the code wasn't really friendly to anyone but me.  I also did a number of things that are environment specific to my SQL Server environment, and were overly complex to try to explain online the how and or why behind them.  So in the end I reworked a majority of my own code into what I hope is an easy to follow, and easy to implement article series that I put up on the MSDN Forums Example site we use for the SQL Server Forums.

http://code.msdn.microsoft.com/SQLExamples/Wiki/View.aspx?title=AutomatedDBA

If you happen to have problems with any of the scripts, please let me know by leaving me a comment or sending me an email, and I will correct the problem immediately.

Wednesday, October 29, 2008

SQL 2008 Data Collector - Custom Performance Counter Set

During my session "Server Monitoring Made Simple with SQL 2008" I covered the new Performance Studio, Management Data Warehouse, and Data Collectors in SQL Server 2008. Someone asked how one would create a custom Performance Counter Collection and I wasn't prepared to answer that particular question. However, I provided my blog link in my slide deck, and I said I would find the answer and post it, so hopefully that person actually reads my blog at some point, but if not, maybe someone else will benefit from this example.

If you were to do a search online, you will find a number of examples that don't work and generate a XML error when you try to run the code. The reason for this, is that almost every example I could find was written for CTP6 of SQL Server 2008. I was able to figure out the proper XML namespace reference that is needed in the RTM of SQL Server 2008 to create a custom collector.

Before you actually go out and create a completely custom data collector for performance counters, you should consider something. The System Activity Collection Set that is one of the System Collection Sets, already includes over 60 performance counters as a collection item. You can see what ones are already included by running the following query:


SELECT name, frequency, parameters
FROM syscollector_collection_items
WHERE name = 'Server Activity - Performance Counters'

Since the definition of the collection items is XML based, you can click the XML Document and it will open in a new window with friendly formatting. If you find that the default counters don't meet your specific needs, then you can use the following example to create a custom collection set:


use msdb;
--First create the collection set
declare @collection_set_id int
declare
@collection_set_uid uniqueidentifier

exec
[dbo].[sp_syscollector_create_collection_set]
@name=N'Performance Counter Collection Set',
@collection_mode=0, --Let's start in cached mode.
@description=N'Collects Performance Counters from PerfMon',
@target=N'', --Undocumented
@logging_level=0, --0 through 2 are valid
@days_until_expiration=5, --Let's just keep data 5 days. We will rollup for reporting.
@proxy_name=N'', --Use if you want it to run under something other than the SQL Agent svc account.
@schedule_name=N'CollectorSchedule_Every_5min', --Built in schedule
@collection_set_id=@collection_set_id output,
@collection_set_uid=@collection_set_uid output

-- Now create the collection item for the Performance Counters to be collected
declare @collector_type_uid uniqueidentifier
declare
@collection_item_id int

select
@collector_type_uid = collector_type_uid
from [dbo].[syscollector_collector_types]
where name = N'Performance Counters Collector Type';


exec [dbo].[sp_syscollector_create_collection_item]
@name=N'Standard SQL Server Performance Counters',
@parameters=N'
<ns:PerformanceCountersCollector xmlns:ns="DataCollectorType">
<PerformanceCounters Objects="Processor" Counters="% Processor time" Instances="_Total" />
<PerformanceCounters Objects="Processor" Counters="% Privileged time" Instances="_Total" />

<PerformanceCounters Objects="Memory" Counters="Available KBytes" Instances="*" />
<PerformanceCounters Objects="Memory" Counters="Pages/sec" Instances="*" />
<PerformanceCounters Objects="Memory" Counters="Committed Bytes" Instances="*" />
<PerformanceCounters Objects="Memory" Counters="Commit limit" Instances="*" />

<PerformanceCounters Objects="System" Counters="Processor Queue Length" Instances="*" />
<PerformanceCounters Objects="System" Counters="Context Switches/sec" Instances="*" />

<PerformanceCounters Objects="PhysicalDisk" Counters="Avg. Disk Queue Length" Instances="_Total" />
<PerformanceCounters Objects="PhysicalDisk" Counters="Avg. Disk sec/Read" Instances="_Total" />
<PerformanceCounters Objects="PhysicalDisk" Counters="Avg. Disk sec/Write" Instances="_Total" />
<PerformanceCounters Objects="PhysicalDisk" Counters="Disk Reads/sec" Instances="_Total" />
<PerformanceCounters Objects="PhysicalDisk" Counters="Disk Writes/sec" Instances="_Total" />
<PerformanceCounters Objects="PhysicalDisk" Counters="Disk Read Bytes/sec" Instances="_Total" />
<PerformanceCounters Objects="PhysicalDisk" Counters="Disk Write Bytes/sec" Instances="_Total" />

<PerformanceCounters Objects="Process" Counters="% Processor time" Instances="sqlservr" />

<PerformanceCounters Objects="SQLServer:Buffer Manager" Counters="Buffer Cache hit ratio" Instances="*" />
<PerformanceCounters Objects="SQLServer:Buffer Manager" Counters="Checkpoint pages/sec" Instances="*" />
<PerformanceCounters Objects="SQLServer:Buffer Manager" Counters="Page life expectancy" Instances="*" />

<PerformanceCounters Objects="SQLServer:Memory Manager" Counters="Total Server Memory (KB)" Instances="*" />
<PerformanceCounters Objects="SQLServer:Memory Manager" Counters="Target Server Memory(KB)" Instances="*" />

<PerformanceCounters Objects="SQLServer:SQL Statistics" Counters="Batch requests/sec" Instances="*" />
<PerformanceCounters Objects="SQLServer:SQL Statistics" Counters="SQL Compilations/sec" Instances="*" />
<PerformanceCounters Objects="SQLServer:SQL Statistics" Counters="SQL Re-Compilations/sec" Instances="*" />

<PerformanceCounters Objects="SQLServer:Databases" Counters="Transactions/sec" Instances="_Total" />
<PerformanceCounters Objects="SQLServer:Databases" Counters="Data File(s) Size (KB)" Instances="_Total" />

<PerformanceCounters Objects="SQLServer:General Statistics" Counters="User Connections" Instances="*" />
</ns:PerformanceCountersCollector>'
,
@collection_item_id=@collection_item_id output,
@frequency=5,
@collection_set_id=@collection_set_id, --output from sp_syscollector_create_collection_set
@collector_type_uid=@collector_type_uid

--Start the collection
exec sp_syscollector_start_collection_set @collection_set_id = @collection_set_id --output from sp_syscollector_create_collection_set


Some thanks must go out to Jason Massie whose original post on this topic was the original foundation for the modified script above. You can find his original post titled Creating a custom data collection in SQL Server 2008 on his blog http://www.statisticsio.com. It is one of the entries that was written for CTP6, but provided the foundation for what I have posted above, so I have to give credit where due.

Wednesday, October 22, 2008

Doing a Live Meeting Presentations - Lessons Learned

I did a Live Meeting Presentation for the PASS DBA SIG today on my lunch break, and what I had initially thought would be a easy online presentation rapidly fell apart.  Despite having practiced and tested the Live Meeting settings with the meeting coordinator, there were issues that prevented the attendees from joining onto the Live Meeting.  Had this been the only issue, the result would have simply been a minor delay as the meeting coordinator was able to login and get everyone connected to the meeting. 

However, despite testing and running through the presentation ahead of time, ensuring that my demonstrations worked and were ready, I had issues with SSMS consistently crashing, and none of my SQL Agent Task demonstrations working as expected.  The root cause which I have figured out two hours later was the installation of a new IPS agent on all of our machines at work, including laptops which get plugged into the corporate domain.  This was installed in the background while I was working this morning.  I guess that will teach me to plug into the network a bit more often with my laptop in the future.

Hopefully everyone who attended got something out of the meeting.  It didn't quite go as I had expected at all, but I was able to cover the content.  A copy of all the code and the database I use will be available on the PASS site as well as on the MSDN Code Project SQL Examples site that we use on the forums in the coming days.  I'll post links to both when they have been put up.

If you attended the event, and have any feedback, please feel free to contact me by email and let me know your thoughts.  I am always open to criticism, as it will only help me improve in the future.

Friday, October 17, 2008

Automating Common DBA Tasks

Wednesday, October 22, 2008, I will be presenting a Live Meeting session for the Database Administration Special Interest Group of PASS at 12pm EST (Noon).  Information on the Live Meeting can be found on the link above, but I will post it here as well:

Meeting Abstract
Database Administrators often spend hours each day doing the same repetitive tasks; checking Error Logs, Backups, Drive Space, Agent History, Job Logs, and other common “checklist” items.  Learn how to easily automate these common tasks in SQL Server 2000, 2005 and 2008 using the tools that are already available in the Operating System and SQL Server.

Meeting Details
Meeting URL: www.livemeeting.com/rm/microsoft/join
Meeting ID: SIGS
Meeting Key: SGISSIGS
Audio Conferencing (Toll-free): 1 (866) 231-6479
Participant Code: 2775795
Please mute your line once you dial-in to the audio portion of the meeting.

FIRST TIME USERS: To save time before the meeting, check your system to make sure it is compatible with Microsoft Office Live Meeting at www112.livemeeting.com/cc/microsoft


Hope to see you there.

Tuesday, October 14, 2008

Using SQL Client Configuration Alias to Create Linked Server

This post has been migrated to my new blog on SQLBlog.com. You can find this post at the following address:

http://sqlblog.com/blogs/jonathan_kehayias/archive/2008/10/14/using-sql-client-configuration-alias-to-create-linked-server.aspx

Tuesday, September 30, 2008

SQL Saturday #8 Orlando - October 25, 2008

I'll be presenting two sessions at SQL Saturday in Orlando next month.  Virtualizing SQL Server, and Monitoring SQL Server 2008.  Don't know what SQL Saturday is?  Find out more on the SQL Saturday website:

SQLSaturday #8 - Orlando 2008

There will also be an upcoming SQL Saturday event in Tampa at the beginning of 2009 hosted by the Tampa SQL Users Group, of which I am a member.  You can monitor this event as it  grows at the following site as well:

SQLSaturday #10 - Tampa 2009

Hope to see you there.  Also if there are any specific questions regarding one of the two topics above, send me a message, and I will try to cover that as a part of the presentation.

Saturday, September 27, 2008

Monitoring the Plan Cache

If you run SQL Server on a 64bit server, then something that you should be monitoring from time to time is the size of your procedure cache.  This is especially important if you have an application that issues adhoc/non-parameterized queries against the SQL Server.  Since the procedure cache is stored as a part of the BPool, it can starve your buffer cache for precious memory.  A simple query that can help monitor this is:

with plancache_cte as
(select single=sum(case usecounts when 1 then 1    else 0 end),
        singlesize=sum(case usecounts when 1 then cast(size_in_bytes as bigint)/1024 else 0 end),
        reused=sum(case usecounts when 1 then 0 else 1 end),
        reusedsize=sum(case usecounts when 1 then 0 else cast(size_in_bytes as bigint)/1024 end),
        total=count(usecounts),
        totalsize=sum(cast(size_in_bytes as bigint)/1024)
from sys.dm_exec_cached_plans)

select
'Single use plans (usecounts=1)'= single,
'Single use plans size KB (usecounts=1)'= singlesize,
'Re-used plans (usecounts>1)'= reused,
'Re-used plans size KB (usecounts>1)'= reusedsize,
're-use %'=cast(100.0*reused / total as dec(5,2)),
'total usecounts'=total,
'total cache size'=totalsize
from plancache_cte

The SQL Programability Team blogged a wonderful series of blog posts in January 2007, that cover this topic and explain exactly what is going on and how it was somewhat fixed in Service Pack 2 of SQL Server 2005

http://blogs.msdn.com/sqlprogrammability/archive/2007/01.aspx

Wednesday, September 24, 2008

Monitoring for Blocked Processes On SQL 2005 - Extended Version

To help better clarify how to do an end to end monitoring of blocked processes on SQL Server 2005 I am going to expand upon my previous blog posting.  To begin with, it is necessary to configure the blocked process threshold on the SQL Server so that it generates the blocked process report in a trace output:

sp_configure'show advanced options',1 ;
GO
RECONFIGURE
;
GO
sp_configure'blocked process threshold',5 ;
GO
RECONFIGURE
;
GO

I chose the value 5 because if something is blocked for more than 5 seconds then that is a significant delay in performance and it is the lowest value you can set.  Once this has been done, a single event trace can be created to run on the server that will log the blocked process reports that get generated.  The below script will create this trace:

/****************************************************/
/* Created by: SQL Server Profiler 2005 */
/* Date: 09/24/2008 11:12:03 AM */
/****************************************************/

-- Create a Queue
declare @rc int
declare
@TraceID int
declare
@maxfilesize bigint
set
@maxfilesize = 50
exec @rc = sp_trace_create @TraceID output, 2, N'c:\BlockedProcessTrace', @maxfilesize, NULL
if (@rc != 0) goto error
-- Client side File and Table cannot be scripted
-- Set the events
declare @on bit
set
@on = 1
exec sp_trace_setevent @TraceID, 137, 15, @on
exec sp_trace_setevent @TraceID, 137, 1, @on
exec sp_trace_setevent @TraceID, 137, 13, @on

-- Set the Filters
declare @intfilter int
declare
@bigintfilter bigint
-- Set the trace status to start
exec sp_trace_setstatus @TraceID, 1
-- display trace id for future references
select TraceID=@TraceID
goto finish
error:
select
ErrorCode=@rc
finish:
go


Make note of the TraceID that is output from running the above script.  Also not every SQL Server Service account can write to the root of the C drive.  None of my production servers can, but I am building this demo on my laptop where it can.  Make sure that a correct path is specified for the trace file.  Most servers will output traceid = 2 for this since there is the default trace running in SQL Server 2005.  Keep this number because it is needed to stop and delete the trace later on.


Now that the trace is active, to test it and demonstrate the blocked process report output open a new SSMS query window and run the following script:


use tempdb
create table temp1
(rowid int)
insert into temp1 values (1)


Then open another new query window and run the following script:


begin tran
update
temp1
set rowid = rowid + 1


This will leave an open blocking transaction against the temp1 table in tempdb.  Now open another (my this is a lot of windows isn't it) query window and run the following script:


select * from temp1


Let it sit for about 10-20 seconds, and then kill the execution and close the query window.  Then rollback the transaction in the update query window and close that window as well (see I am cleaning up as we go).  The run the following query to clean up the rest of the example:


drop table temp1
--stop the trace
exec sp_trace_setstatus 2, 0
--delete the trace but leaves the file on the drive
exec sp_trace_setstatus 2, 2


Now to look at the output in the trace file run the following query:


select cast(TextData as xml), SPID, EndTime, Duration/1000/1000
from fn_trace_gettable(N'c:\BlockedProcessTrace.trc', default)
where eventclass = 137


By casting the TextData to an xml datatype you can click on it and have it open up formatted in SSMS.  The output will be similar to the following:


<blocked-process-report monitorLoop="160986">
<
blocked-process>
<
process id="process929d38" taskpriority="0" logused="0" waitresource="RID: 2:1:480:0" waittime="17953" ownerId="123106201" transactionname="SELECT" lasttranstarted="2008-09-24T16:39:38.620" XDES="0x9bc3920" lockMode="S" schedulerid="2" kpid="2064" status="suspended" spid="145" sbid="0" ecid="0" priority="0" transcount="0" lastbatchstarted="2008-09-24T16:39:38.620" lastbatchcompleted="2008-09-24T16:39:10.667" clientapp="Microsoft SQL Server Management Studio - Query" hostname="SQLDEMO" hostpid="4944" loginname="SQLDEMO\DemoUser" isolationlevel="read committed (2)" xactid="123106201" currentdb="2" lockTimeout="4294967295" clientoption1="671090784" clientoption2="390200">
<
executionStack>
<
frame line="1" sqlhandle="0x0200000088baad31046d031f04c8e7293882ce42521d893f" />
</
executionStack>
<
inputbuf>
select * from temp1 </inputbuf>
</
process>
</
blocked-process>
<
blocking-process>
<
process status="sleeping" spid="78" sbid="0" ecid="0" priority="0" transcount="1" lastbatchstarted="2008-09-24T16:39:37.060" lastbatchcompleted="2008-09-24T16:39:47.057" clientapp="Microsoft SQL Server Management Studio - Query" hostname="SQLDEMO" hostpid="4944" loginname="SQLDEMO\DemoUser" isolationlevel="read committed (2)" xactid="123105638" currentdb="2" lockTimeout="4294967295" clientoption1="671090784" clientoption2="390200">
<
executionStack />
<
inputbuf>
begin tran
update temp1
set rowid = rowid + 1

waitfor delay '00:00:10' </inputbuf>
</
process>
</
blocking-process>
</
blocked-process-report>


From this, you can see what is blocked as well as what is blocking.  Begin looking at the blocking process to determine why it is blocking.  If you can solve that problem then the issue goes away.


Hope it helps.